Editing Record Dimensions
At a glance
- These fields control the size of different aspects of the presentation of the record.
- And (a) the sequence or ordering of a record in relation to other records in the exhibit.
- Dimension values are stored as natural numbers (integers greater than 0).
- To change a dimension, you can type directly into the field.
- Or you can click on the field and drag up or down on the page, causing the value to change smoothly.
- When the “Stroke Width” and “Point Radius” fields are changed, the new value will automatically preview on the map.
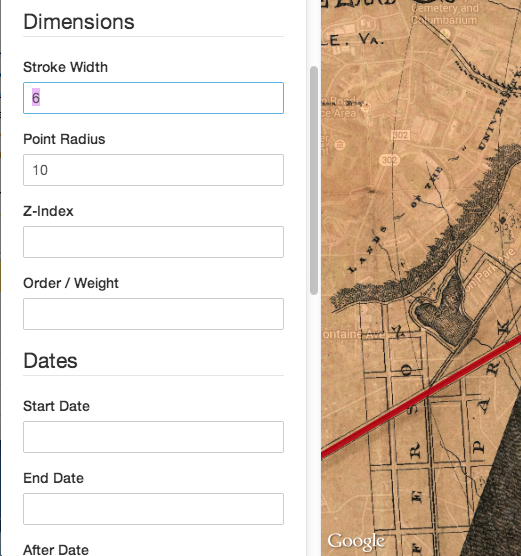
Stroke Width
The width, in pixels, of the lines that run around the edges of a shape on the map. Generally, it makes sense to keep this value in the range of 0-10 - anything more and the lines will start to “clump” together and blot out the shape of the polygon, especially when the map is zoomed back away from the vectors.
In some cases, it can be aesthetically pleasing to completely hide the lines, and just display the “area” of points and polygons on the map. To do this, just set the stroke width to 0.
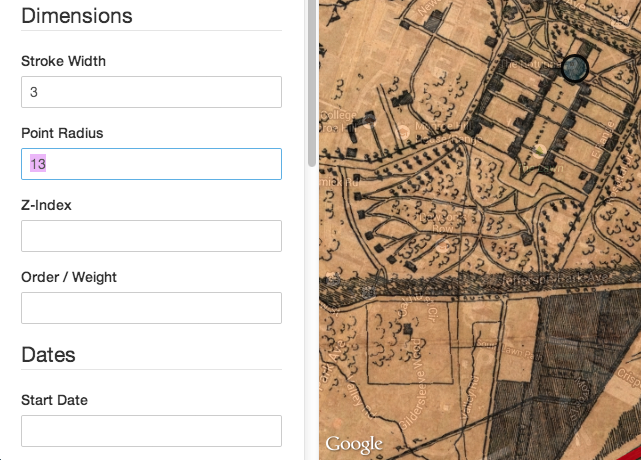
Point Radius
The radius of individual points on the map. You’ll almost always want this value to be greater than 0 - otherwise, points will be invisible, in which case they should probably just be deleted. If you’re making use of the “Point Image” field to change the visual representation of points (see the “Editing Record Imagery” guide), this field will also determine the size of the image graphics overlayed on the map.
Important: The point radius is a static value, meaning that the size of the points on the map won’t change with the zoom level of the map, as a polygon or line would. This is because points are actually just dimensionless pairs of lat/lon coordinates. Since they’re infinitely small and have no measurable “size” that can be correlated to the scale of the map, the points will always stay the same size, regardless of the zoom level of the map
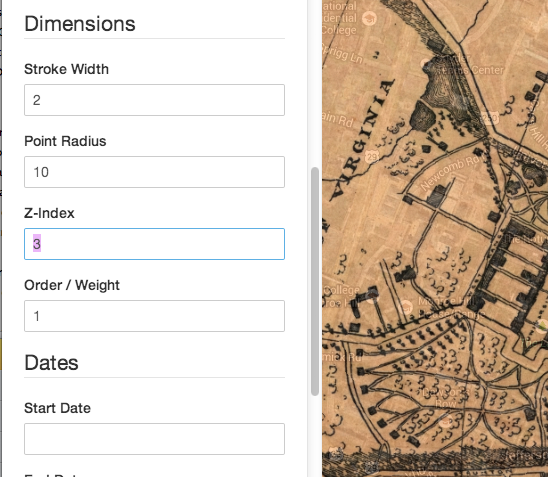
Z-Index
The “stacking” order of vector annotations and WMS layers on the map. For example, imagine you have one record that includes a polygon that traces the shape of Manhattan, and another record that traces the shape of Central Park. Since Central Park is contained inside of Manhattan, you’ll want the Central Park polygon to be displayed “on top of” the Manhattan polygon - otherwise, it would be impossible for the user to click on Central Park.
Z-indexes are just relative numbers that control the display order, with higher numbers stacking above lower numbers. So, in this case, you could set the Z-Index on Manhattan to 1, and the Z-Index on Central Park to 2, and Central Park would always be displayed on top of Manhattan.
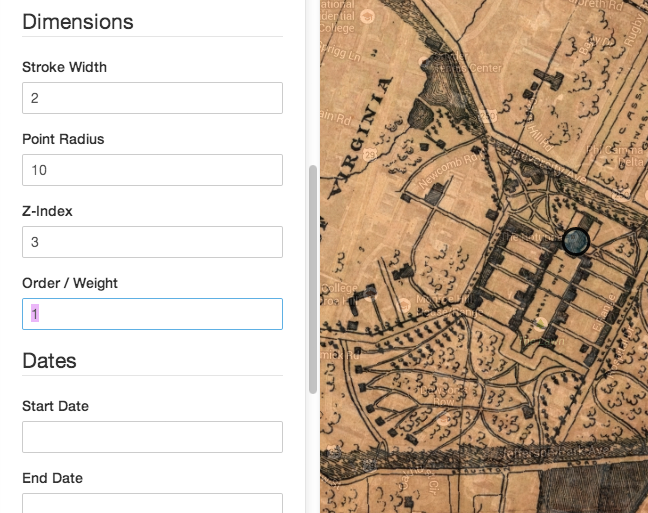
Order / Weight (Experimental, subject to change)
The display order of a record relative to other records. This is similar to the “Z-Index,” but designed to be used in situations where records need to be put into a specific, unambiguous sequence (ie, where no two records can be in the same position in the sequence, as opposed to stacking order, in which multiple records can exist on the same “layer” or “level”). For example, this field is automatically populated by the Neatline Waypoints plugin to store the display order of records in the waypoints panel, a list of clickable record titles displayed on the map.
Important: For now, this is an abstract field that has no direct effect on out-of-the-box Neatline exhibits. It’s included in the current version to make it possible for sub-plugins to store ordering information about records. Unless you’re using a sub-plugin that makes use of the field, it usually makes sense just to leave it blank.