Editing Record Imagery
At a glance
- These fields make it possible to layer images on top of the map base layer - thumbnails, historical maps, etc.
- The “Point Image” field replaces the default circular graphic for points with any web-accessible image.
- The “WMS Address/Layers” fields make it possible to overlay a WMS layer hosted by software like Geoserver.
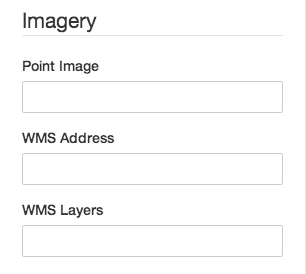
Point Image
By default, points on the map are represented with circle graphics, the size of which can be configured by the “Point Radius” field in the “Dimensions” field set. This field makes it possible to replace this default representation of the points with any random, web-accessible image. This makes it possible to place effectively any kind of graphic on the map - pins, icons, image thumbnails, etc.
Once a “Point Image” is provided, the points continue to behave just like regular points in all other ways. For example, you can change the size of the point-images by changing the “Point Radius” field, and you can configure the opacities by changing the “Fill Opacity” and “Fill Opacity (Selected)” fields.
Point images can be the web-accessible location of any image. For example, to use the Neatline logo:
/assets/wp-content/themes/neatline-wp-theme/images/neatline-logo-rgb.png
Important: Since we’re really just changing the cosmetic appearance of the points, there are some restrictions:
-
Like regular points, point-images will always stay the same size (the value of “Point Radius”), no matter what the zoom level of the map. If you need an image to scale depending on the zoom level, you’ll need to use a WMS overlay hosted by Geoserver (see below).
-
Point-images can’t be “rotated” - they will always have the exact orientation of the source image. Again, if you find yourself wanting to pivot the image to make it line up with something on the underlying base layer, you’re probably looking for the type of functionality provided by a WMS overlay.
Tip: When preparing images for use as point-images, try to use image types like *.png that support transparency. Otherwise, you’ll have unsightly white or black boxes filling in the negative space surrounding the graphics.
WMS Address
The location of a web-accessible Web Map Service server like Geoserver. This field has to link directly to the WMS API endpoint on the server, such as:
http://libsvr35.lib.virginia.edu/geoserver/hotchkiss/wms
See also: Tutorial: Neatline for Historical Maps by Kristen Mapes.
WMS Layers
A comma-delimited list of layers on the served defined by “WMS Layers,” such as:
hotchkiss:fredericksburg,hotchkiss:chancellorsville
Once a WMS address and layer name has been entered, Neatline will automatically overlay the requested layers on top of the base layer. WMS layers react to many of the same styling, visibility, ordering settings that can be used to configure the behavior of regular vector annotations:
-
Use the “Fill Opacity” field to control the opacity of the WMS overlay.
-
If an “After Date” or “Before Date” is defined for the record, the WMS layers will appear and disappear as the timeline is dragged in and out of the visibility interval defined by the date fields. For example, if the “After Date” is set to
2000, the WMS layer will be invisible when the timeline is focused at1999. -
If a “Min Zoom” or “Max Zoom” is defined for the record, the WMS layer will appear and disappear as the map is zoomed in and out of the visibility interval defined by the zoom fields. For example, if “Min Zoom” is set to
10, the WMS layer will be invisible when the map is at zoom level9.